Washington DC – According to a review by the SUN DAY Campaign of data just released by the Federal Energy Regulatory Commission (FERC) and the U.S. Energy Information Administration (EIA) solar and wind have made a strong start in 2021.
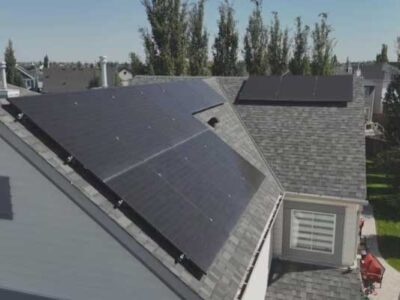
The latest issue of EIA’s “Electric Power Monthly” (with data through January 31, 2021) reveals that utility-scale solar thermal and photovoltaic (PV) plants produced 23.1% more electricity in January 2021 than they did a year earlier while estimated small-scale solar (e.g., rooftop PV systems) increased by 18.8%. Combined, and notwithstanding the Covid pandemic, solar grew 21.7% and provided 2.4% of the nation’s electrical output.
Wind also showed strong growth, increasing by 6.6% in January 2021, compared to the first month of 2020, and provided 8.6% of U.S. electrical output. Together, wind and solar increased by 9.5% and accounted for a bit more than 11.0% of net generation in January.
Along with other “green” energy sources (i.e., biomass, geothermal, hydropower), renewables grew by 6.3% and accounted for more than a fifth (20.2%) of U.S. electrical production in January 2021compared to 19.6% the year before.
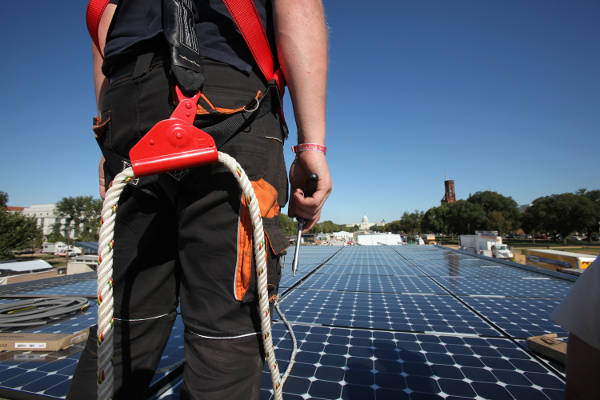
Meanwhile, FERC’s latest monthly “Energy Infrastructure Update” report (also with data through January 31, 2021) reveals that solar and wind provided all of the new electrical generating capacity added in the first month of this year. Twenty-seven “units” of utility-scale solar provided 724-MW while two units of wind added 554-MW.
Renewable energy sources collectively now account for 24.30% of the nation’s total available installed generating capacity [1] and continue to expand their lead over coal (19.43%) and nuclear power (8.50%). The generating capacity of just wind (9.93%) is nearly a tenth of the nation’s total while wind and solar combined account for 14.46% … and that does not include distributed (e.g., rooftop) solar. [2]
For perspective, ten years ago, FERC reported that installed renewable energy generating capacity was 13.82% of the nation’s total. Five years later, it had increased to 17.93%. With current capacity now at 24.30%, renewables now appear to be on track to reach – and likely exceed – 30% of the nation’s total generating capacity by 2025.
In fact, FERC data suggest that renewables’ share of generating capacity is on track to increase significantly over the next three years (i.e., by January 2024). “High probability” generation capacity additions for wind, minus anticipated retirements, reflect a projected net increase of 22,338-MW while solar is foreseen growing by substantially more – 37,928-MW. By comparison, net growth for natural gas will be only 15,175-MW. Thus, wind and solar combined are forecast to provide nearly four times (3.97%) as much new generating capacity as natural gas over the next three years. Hydropower is also projected to experience growth (931-MW), while biomass and geothermal may dip by 219-MW and 2-MW respectively.
On the other hand, the generating capacities of coal and oil are projected to plummet – by 25,380-MW and 4,009-MW respectively. In fact, FERC reports no new coal capacity in the pipeline over the next three years and just 6-MW of new oil-based capacity. Nuclear power is likewise forecast to drop sharply – by 4,330-MW, or more than 4% of its current operating capacity.
In total, the mix of all renewables will add more than 60,976-MW of net new generating capacity to the nation’s total by January 2024 while the net new capacity from natural gas, coal, oil, and nuclear power combined will actually drop by 18,544-MW.
If FERC’s projections prove accurate, over the next three years, renewable energy generating capacity should account for comfortably more than a quarter of the nation’s total available installed generating capacity – increasing to 28.29%. Wind and utility-scale solar alone will be nearing a fifth (18.72%) of the nation’s installed generating capacity. Meanwhile, coal’s share will drop to 16.78%, nuclear’s to 7.88%, and oil’s to 2.75%. Natural gas’ share will also decline slightly to 44.14%, compared to 44.43% now.
In fact, renewables’ share could – and probably will – be even higher. For almost two years, FERC has been regularly increasing its renewable energy projections in the monthly “Infrastructure” reports. FERC’s first such projection – provided in its March 2019 report – forecast the addition of 36,608-MW of wind and solar during the ensuing three years. In its most recent report, those forecasts had grown to 60,976-MW of new solar and wind capacity by January 2024.
Moreover, FERC’s data also outline a second – albeit less probable – a scenario for even higher net additions by solar (153,054-MW) and wind (79,584-MW), which would be close to six times those projected for natural gas (41,024-MW).
“The strong growth by solar and wind during the past decade shows no sign of abating with the start of a new year,” noted Ken Bossong, Executive Director of the SUN DAY Campaign. “They, coupled with other renewable energy sources, appear to be on track to providing a quarter of the nation’s electrical generation and possibly a third of its generating capacity within the next five years.”
# # # # # # # # #
[1] Capacity is not the same as actual generation. Capacity factors for nuclear power and fossil fuels tend to be higher than those for most renewables. As noted in this release, in January 2021, EIA reported that renewables accounted for 20.2% of the nation’s total electrical generation – that is, somewhat less than their share of installed generating capacity (24.3%) for the same month. Conversely, coal’s share of generating capacity was 19.4% while its share of electrical generation was 23.1%.
[2] FERC generally only reports data for utility-scale facilities (i.e., those rated 1-MW or greater) and therefore its data do not reflect the capacity of distributed renewables, notably rooftop solar PV which – according to the EIA – accounts for nearly a third of the nation’s electrical generation by solar. That would suggest that the total of distributed and utility-scale solar capacity combined may be as much as 50% higher than the solar capacity of 4.5% reported by FERC — i.e., possibly closer to 7%.


Comments