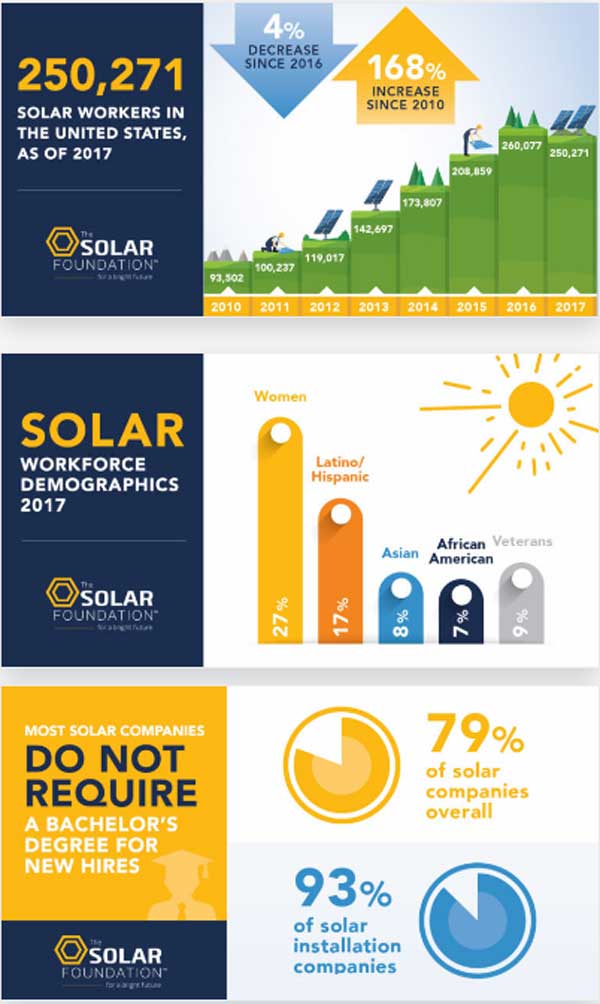
For the first time since The Solar Foundation started tracking solar jobs in 2010, employment in the U.S. solar industry has decreased.
The latest Solar Jobs Census found that 250,271 people work in solar as of 2017, a 3.8 percent decline, or about 9,800 fewer jobs, since 2016. This decrease was both recorded in the utility-scale and residential solar sectors of the industry.
2017 trends for solar jobs varied widely state by state.
The report adds that California remains the state with the largest number of solar jobs, decreasing 14 percent in 2017. Massachusetts came in second with regards to the solar workforce, with a 21 percent decrease in employment.
While this report’s findings present some devastating news, it also notes that employment in the industry far outpaces that of the coal, wind and nuclear energy industries.
A list of factors contributed to this disappointing data including a number of bankruptcies, and the fact that some solar companies couldn’t sign-up enough new customers.
From 2010 to 2016, the number of solar jobs in the U.S. nearly tripled, increasing from 93,000 to more than 260,000.
The industry had a total of 250,271 employees last year, a 168 percent increase from 2010. The Solar Foundation said “while 2017 represents a setback, the trend is short-term rather than indicative of greater peril”.
It might seem like a coincidence, but the U.S. solar industry has lost a lot of jobs during Trump’s first year in office.
Is it because the industry is concerned about what’s in store for it under Trump? What do you think?

The Solar Foundation’s annual National Solar Jobs Census is a comprehensive report on employment trends within the U.S. solar industry, nationwide and state by state. The latest Solar Jobs Census includes data for 2017.


Comments