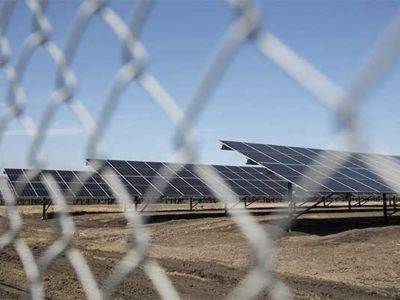
The electric generation mix in the United States is changing, driven by the transition of coal-fired power plants to natural gas and the increase in low-carbon sources of energy. This transition has required significant build-out of new power generation facilities and technologies in the U.S.
Electric Power Generation and Fuel technologies directly employ more than 1.9 million workers, according to the Department of Energy’s (DoE) 2017 US Energy and Employment Report.
The 2017 U.S. Energy and Employment Report (USEER) states that Traditional Energy and Energy Efficiency sectors today employ approximately 6.4 million Americans. These sectors increased in 2016 by just under 5 percent, adding over 300,000 net new jobs, roughly 14 percent of all those created in the country.
In 2016, 55 percent, or 1.1 million, of these employees worked in traditional coal, oil, and gas, while almost 800,000 workers were employed in low carbon emission generation technologies, including renewables, nuclear, and advanced/low emission natural gas.
Just under 374,000 individuals work, in whole or in part, for solar firms, with more than 260,000 of those employees spending the majority of their time on solar.
There are an additional 102,000 workers employed at wind firms across the U.S. The solar workforce increased by 25 percent in 2016, while wind employment increased by 32 percent.
The leading states for solar, and wind employment is California and Texas, respectively. A total of 41 percent of solar jobs is in California, while 24 percent of the wind workers are in Texas.
According to the Energy Information Administration, electric generation technologies are expected to add over 26 GW of utility-scale capacity over 2016. The majority of these additions are coming from three main resources: solar (9.5 GW), natural gas (8 GW), and wind (6.8 GW). Together, these three sources make up 93 percent of total additions.
In the chart below, net generation from coal sources declined by 53 percent between 2006 and September 2016, while electricity generation from natural gas increased by 33 percent and solar by over 5,000 percent—from 508,000 MWh to just over 28,000,000 MWh. The solar growth only includes utility-scale facilities.
In fact, between September 2015 and September 2016 alone, distributed solar photovoltaic generation increased 35 percent nationwide, while estimated total solar—both utility-scale and distributed generation—increased by 52 percent across the country.
These shifts in electric generation source are mirrored in the sector’s changing employment profile, as the share of natural gas, solar, and wind workers increases, while coal mining and other related employment is declining.
It is important to note, however, that the majority of U.S electrical generation continues to come from fossil fuels (coal and natural gas) and that, under latest EIA modeling in the Annual Energy Outlook 2016, will continue to provide 53 percent of total U.S. electricity in 2040.
NOTE: Excerpts in this article are adapted from the latest Department of Energy’s (DoE) 2017 U.S Energy and Employment Report.


Comments