


- The estimated share of renewable energy in global electricity generation is more than 26 percent.
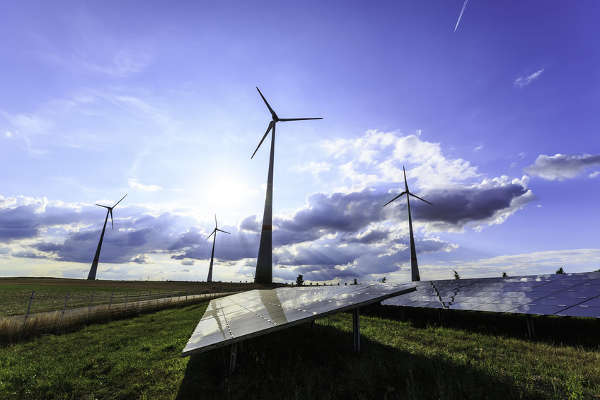
- Researchers have published a study which shows where solar and wind farms are based around the world.
- It demonstrates both their infrastructure density in different regions and approximate power output.
Researchers at the University of Southampton have mapped the global locations of major renewable energy sites, providing a valuable resource to help assess their potential environmental impact.
Their study, published in the Nature journal Scientific Data, shows where solar and wind farms are based around the world — demonstrating both their infrastructure density in different regions and approximate power output. It is the first-ever global, open-access dataset of wind and solar power generating sites.
The estimated share of renewable energy in global electricity generation was more than 26 percent by the end of 2018 and solar panels and wind turbines are by far the biggest drivers of a rapid increase in renewables. Despite this, until now, little has been known about the geographic spread of wind and solar farms and very little accessible data exists.
Lead researcher and Southampton Ph.D. student Sebastian Dunnett explains: “While global land planners are promising more of the planet’s limited space to wind and solar energy, governments are struggling to maintain geospatial information on the rapid expansion of renewables. Most existing studies use land suitability and socioeconomic data to estimate the geographical spread of such technologies, but we hope our study will provide more robust publicly available data.”
While bringing many environmental benefits, solar and wind energy can also have an adverse effect locally on ecology and wildlife. The researchers hope that by accurately mapping the development of farms they can provide an insight into the footprint of renewable energy on vulnerable ecosystems and help planners assess such effects.
The study authors used data from OpenStreetMap (OSM), an open-access, collaborative global mapping project. They extracted grouped data records tagged ‘solar’ or ‘wind’ and then cross-referenced these with select national datasets in order to get a best estimate of power capacity and create their own maps of solar and wind energy sites. The data show Europe, North America and East Asia’s dominance of the renewable energy sector, and results correlate extremely well with official independent statistics of the renewable energy capacity of countries.
Study supervisor, Professor Felix Eigenbrod of Geography and Environmental Science at the Southampton comments: “This study represents a real milestone in our understanding of where the global green energy revolution is occurring. It should be an invaluable resource for researchers for years to come, as we have designed it so it can be updated with the latest information at any point to allow for changes in what is a quickly expanding industry.”

Comments