


- The NREL's latest analysis unveils a mix of price trends in the US solar PV market, with residential system costs seeing a notable reduction, while utility-scale systems face a price hike.
- For the first time, the report also benchmarks the costs associated with community solar, shedding light on this growing sector.
- The evaluation further outlines how the Inflation Reduction Act's manufacturing tax incentives are playing a role in shaping these cost dynamics.
The National Renewable Energy Laboratory (NREL) has released its annual cost breakdown of installed solar photovoltaic (PV) and battery storage systems.
The report, “U.S. Solar Photovoltaic System and Energy Storage Cost Benchmarks, With Minimum Sustainable Price Analysis: Q1 2023,” details installed costs for PV and storage systems as of the first quarter (Q1) of 2023. Each year, NREL analysts publish benchmarks that track solar cost trends to support the U.S. Department of Energy Solar Energy Technologies Office’s aim to accelerate the advancement and deployment of solar technology. These benchmarks are bottom-up cost estimates of all aspects of PV and energy storage system installations.
Benchmark prices declined for residential systems, increased for utility-scale systems
Many of the trends that characterized the 2022 benchmarks—including high and volatile component prices and competition for limited supplies—appeared to lessen in 2023.
Compared to last year’s report, modeled market prices for installed residential PV systems were 15% lower this year. Although balance of system costs were higher, those increased costs were more than offset by lower module, inverter, logistics, and customer acquisition costs, resulting in overall cost reductions for the representative residential system.
However, modeled market prices for utility-scale systems were 8% higher in Q1 2023 than in Q1 2022. Higher inverter, labor, and electrical balance of system (EBOS) costs more than offset lower module, structural balance of system (SBOS), and other soft costs in the 2023 report.
“The costs of network upgrades needed to meet interconnection requirements have risen rapidly as the number of projects in the interconnection queue has increased,” said the report’s lead author, Vignesh Ramasamy. “Including network upgrade costs is one way we improved our model this year, and those costs account for much of the increase in EBOS costs compared with last year.”
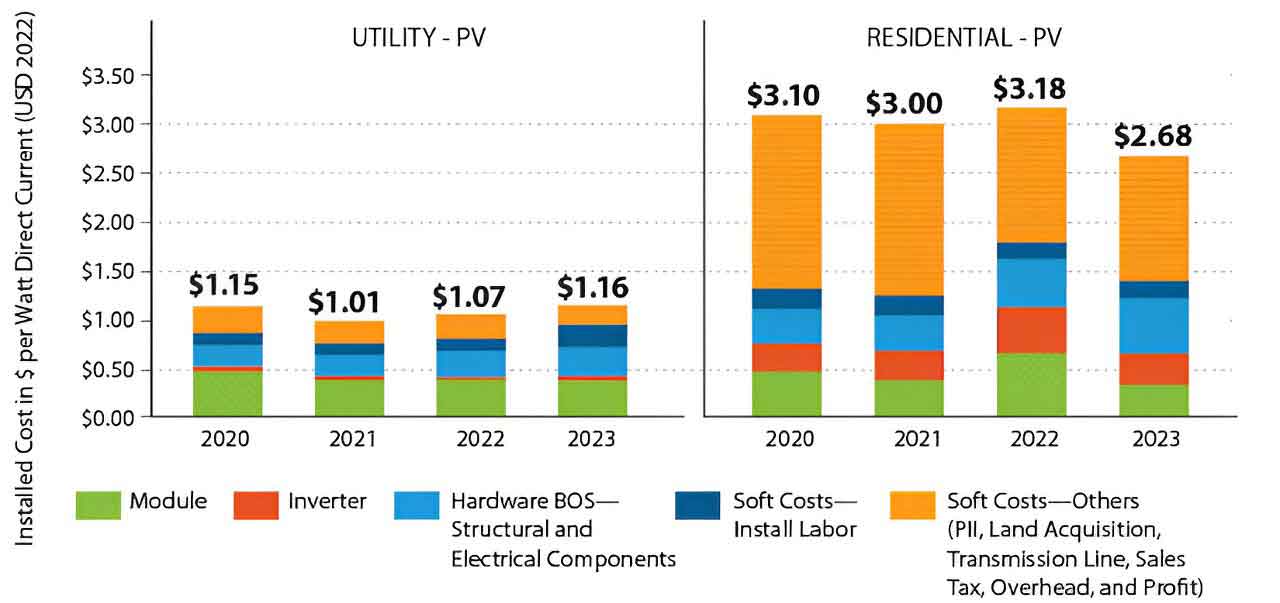
The inflation-adjusted cost benchmark rose in 2023 for utility-scale PV systems but fell for residential PV systems owing to recent trends in network upgrade costs, Inflation Reduction Act manufacturing tax incentives, and other cost drivers. (National Renewable Energy Laboratory)
Inflation reduction act manufacturing tax incentives are likely affecting PV and storage system costs
This year’s Q1 2023 benchmarks reflect the impact of Inflation Reduction Act (IRA) tax incentives to manufacturers for domestically producing and selling clean energy components.
Numerous U.S. manufacturers are likely taking advantage of the IRA’s Section 45X Advanced Manufacturing Production Tax Credit, so NREL analysts accounted for this credit in modeling domestically manufactured component prices.
The cost of any PV system—residential, commercial, or utility-scale—that uses domestically produced components is likely to be affected by the production tax credit. At one extreme, a U.S. manufacturer who receives the credit could pass the entire value to the buyer as a lower component price. At the other, the manufacturer could leave the price unchanged and retain the entire credit as part of their margin. NREL analysts split the difference when modeling the effects of the tax credit on domestically produced components, assuming half of each credit was passed to installers and half was retained by manufacturers.
For further detail and context on how the manufacturing tax credits could be affecting costs, the authors recommend consulting the cost figures and methodology in the report.
Community solar costs are benchmarked for the first time
Community solar is a model for distributing solar energy that allows customers to share in the benefits of a large off-site PV or PV-plus-storage system, often receiving a monthly bill credit for their portion of electricity generation.
Costs for installing community solar resemble the costs of installing a commercial PV system for a single customer, with two distinctions. Community solar systems incur more initial costs to acquire numerous residential and commercial subscribers, and they incur ongoing costs of subscriber management, including bill management as well as marketing and customer acquisition to manage customer turnover.
“Community solar is an increasingly popular way to broaden access to solar energy in the United States,” report co-author Jarett Zuboy said. “This year we modeled subscriber acquisition and management expenses to help put the costs of community solar into context with the equity benefits it provides.”
New modeling approach increases transparency while expanding component-level detail
For this year’s benchmark report, the Solar Energy Technologies Office developed a new bottom-up PV and storage cost model with NREL analysts to make the benchmarks simpler and more transparent—while expanding the model to address components not previously benchmarked.
The new approach builds on the cost models and methods NREL has used for the past decade of PV benchmarking. However, it relies more on direct inputs from industry experts, and it makes the aggregated and anonymized results from those sources publicly available at the subcomponent level. Such transparency into detailed costs can be used to identify the drivers of installed prices and opportunities for system price reductions.
The Q1 2023 data and model are available in NREL’s Data Catalog.
“We developed our models for years to improve our cost benchmarks, but the models themselves were mostly inaccessible from the public’s perspective,” Ramasamy said. “The new model we developed with the Solar Energy Technologies Office provides the public greater access to the inputs and assumptions that influence the benchmark results.”
—
More information: U.S. Solar Photovoltaic System and Energy Storage Cost Benchmarks, With Minimum Sustainable Price Analysis: Q1 2023.
—
Adapted from an article written by National Renewable Energy Laboratory.


Comments