


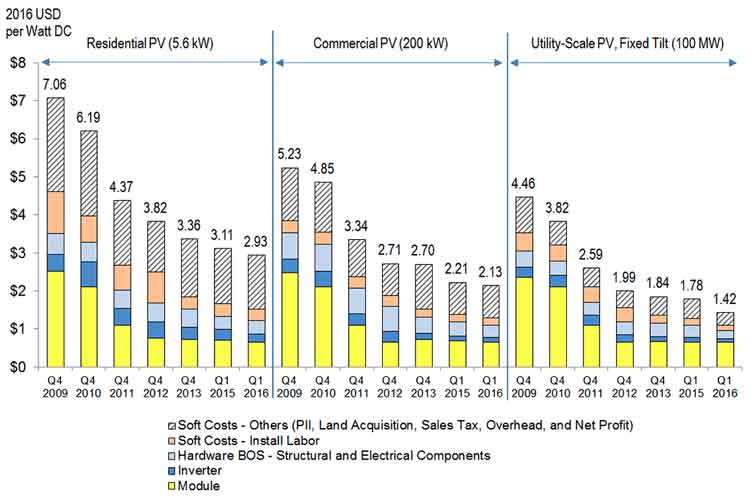
NREL U.S. PV system cost benchmarks, from the fourth quarter of 2009 to the first quarter of 2016
The modeled costs to install solar photovoltaic (PV) systems continued to decline in the first quarter of 2016 in the U.S. residential, commercial, and utility-scale sectors, according to updated benchmarks from the Energy Department’s National Renewable Energy Laboratory (NREL).
Driving the cost reductions were lower module and inverter prices, increased competition, lower installer and developer overheads, improved labor productivity, and optimized system configurations.
“The continuing total cost decline of solar PV systems demonstrates the sustained economic competitiveness of solar PV for the industry across all three sectors,” said NREL Senior Analyst and Project Lead Ran Fu.
The modeled costs for the first quarter of 2016 were down from the fourth quarter of 2015 by 6 percent, 4 percent, and 20 percent in the residential, commercial, and utility-scale sectors, respectively. The costs fell to $2.93 per watt of direct current for residential systems, $2.13 per watt of direct current for commercial systems, and $1.42 per watt of direct current (Wdc) for utility-scale systems for fixed-tilt utility-scale systems, and $1.49 Wdc for one-axis-tracking utility-scale systems.
“Such accurate cost benchmarks are critical for tracking the progress of PV systems toward cost-reduction goals. Because our cost model categorizes hardware and non-hardware costs with a high degree of resolution, the results can also be used to identify specific cost-reduction investment opportunities and assess regional levelized costs of energy,” Fu said.
The new results also highlight the importance of non-hardware, or “soft,” costs. As the pace of cost reductions for modules and inverters has slowed in recent years, the proportion from soft costs-such as labor, overhead, and permitting costs-has grown. In the first quarter of 2016, soft costs accounted for 58 percent of residential system costs, 49 percent of commercial system costs, and 34 percent of utility-scale system costs.
NREL uses a “bottom-up” modeling method to construct total capital costs by quantifying the typical cost of each individual system and project-development component, largely through dialogues and interviews with solar industry collaborators. The results represent total installed system costs from the perspective of the PV project developer or installer, including net profit in the cost of the hardware. The benchmarks are national averages weighted by state installed PV capacities.


Comments