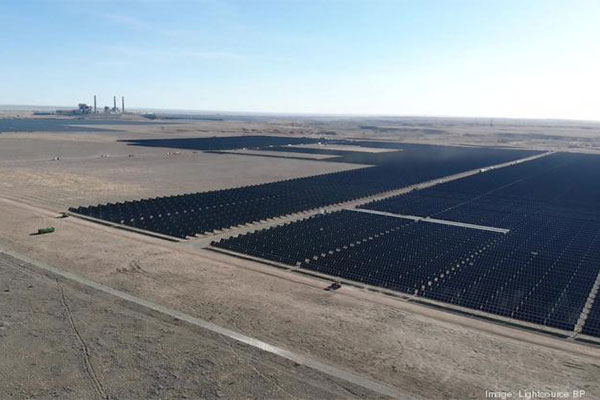
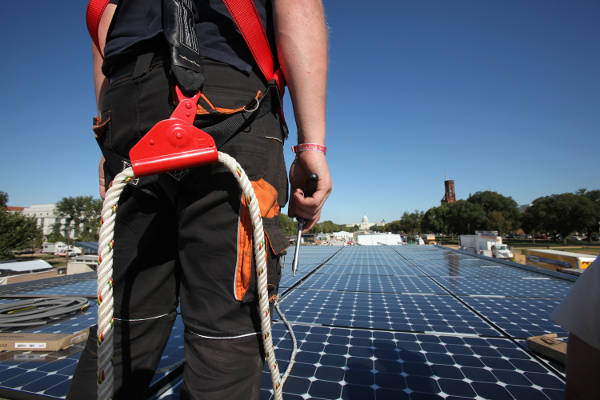
- Recent data unveils solar energy's robust growth in the U.S., with July 2023 marking a significant stride as solar made up over two-thirds of the new generating capacity.
- As projections show, by mid-summer 2026, solar energy is poised to account for nearly 13% of the total installed capacity, overtaking wind, oil, and nuclear.
- This upward trajectory not only signifies the dawn of solar prominence but also heralds a substantial shift towards renewable energy in the national energy mix.
Washington DC – Based upon a review by the SUN DAY Campaign of data newly released by the Federal Energy Regulatory Commission (FERC) and the U.S. Energy Information Administration (EIA), solar notched several significant milestones in July.
In its latest monthly “Energy Infrastructure Update” report (with data through July 31, 2023), FERC says 47 “units” of solar provided 1,824-MW of new U.S. generation capacity or more than two-thirds (67.2%) of the total added during the month. The balance (892-MW) was provided by natural gas. This brought solar’s share of total available installed generating capacity in the U.S. up to 7.12%. [1]
Meanwhile, in its latest “Electric Power Monthly” report (also with data through July 31, 2023), EIA notes that solar-generated electricity increased by 22.3% during the month compared to July 2022. This growth rate was greater than for any other energy source and was driven in part by a 26.6% expansion in the electricity EIA estimates to have been provided by small-scale solar photovoltaics (e.g., distributed, roof-top systems).
Solar-generated electricity totaled 26,785 gigawatt-hours (GWh) – or 6.2% of all electricity generated – and surpassed that provided by hydropower (21,500-GWh) while nearly equaling that provided by the nation’s utility-scale windfarms (27,726-GWh).
Solar’s strong performance in July seems likely to continue. FERC reports that “high probability” additions of solar between August 2023 and July 2026 total 84,392-MW – an amount nearly four times the forecast net “high ‘probability” additions for wind (21,341-MW) and nearly 20 times those reported for natural gas (4,660-MW).
And the numbers for solar may prove to be conservative. FERC also reports that there may actually be as much as 215,688-MW of new solar additions in the three-year pipeline.
If just the “high probability” additions materialize, by mid-summer 2026, solar will account for more than one-eighth (12.9%) of the nation’s installed generating capacity. That would be more than wind (12.4%). Solar’s installed generating capacity by July 2026 would also surpass of oil (2.6%) and nuclear power (7.5%) combined as well as approach that of coal (13.8%). [2]
In three years, natural gas would still comprise the largest share of installed generating capacity (41.8%) but the mix of all renewable sources (i.e., solar plus wind, hydropower, geothermal, and biomass) would total 34.1% and be on track to further reduce natural gas’ lead.
In July 2023 alone, the combination of all renewables provided 81,522-GWh of electric power – more than either coal (78,672-GWh) or nuclear power (69,888-MWh) and FERC’s three-year capacity forecasts suggest renewables’ lead over these sources will continue to expand.
“Solar’s strong growth in both new capacity and actual electrical generation confirms that the emergence of the solar era is well underway,” noted the SUN DAY Campaign’s executive director Ken Bossong. “Within three years, it will account for over an eighth of U.S. generating capacity while the combined generating capacity of all renewable sources will be greater than that of either coal or nuclear power and approaching that of natural gas.”
# # # # # # # # #
Notes:
[1] FERC generally only reports data for utility-scale facilities (i.e., those rated 1-MW or greater) and therefore its data do not reflect the capacity of distributed renewables, notably rooftop solar PV which – according to the U.S. Energy Information Administration (EIA) – accounted for approximately 31% of the nation’s electrical generation by solar during the first seven months of 2023. That would imply that the total of distributed and utility-scale solar capacity combined is significantly more than the solar capacity of 7.12% reported by FERC at the end of the first seven months of 2023 and is perhaps closer to 10.0%.
[2] Generating capacity is not the same as actual generation. Fossil fuels and nuclear power generally have higher “capacity factors” than do wind and solar. For example, EIA reports capacity factors in 2022 for nuclear power and natural gas were 92.6% and 56.7% respectively while those for wind and solar were 36.1% and 24.8%.
—
Adapted from an article written by Ken Bossong of The SUN DAY Campaign.


Comments