


If there’s one sure-fire way to get the ear of most politicians, it’s the word “jobs.”
It seems almost any issue can be framed as either job-growing or job-killing, depending on which side of the issue one wishes to support. All too often, environmental policies are criticized as a threat to jobs, and the false dichotomy of “job vs. the environment” is a well-worn rhetorical strategy of those opposing environmental regulations.
But what about tending to the challenges posed by a warming climate? Addressing climate change is an enormous job creator, across many economic sectors and in every part of the world. Fossil fuels lie at the core of the issue, and fossil fuels are replaceable by other forms of energy that also require human planning, engineering, and labor. No matter what type of fuel we use, the thirst for energy is everlasting; there will be a perpetual need for energy jobs – it’s only a matter of which jobs.
This analysis presents one way to look at renewable energy jobs in all 50 states. Every state already employs people in wind and solar energy. Each state also has a given amount of wind and solar potential. Some states are translating their natural potential into jobs, while others lag far behind.
Following are seven maps, stepping through three questions: How many jobs does each U.S. state have in wind and solar? How much wind and solar potential is there in each state? And how well has each state created jobs in wind and solar, given the size of their potential?
Wind and solar jobs by state
The 2020 U.S. State Energy and Employment Report contains job data for various energy sectors. For the 2020 report, the data were tallied in late 2019, before the COVID-19 pandemic disrupted the energy industry.
Each state report lists the number of jobs in solar electric generation and wind electric generation. Those jobs are in utilities, construction, manufacturing, trade, and professional services.
Nationwide, there were around 344,000 jobs in solar electricity generation by late 2019. California led with nearly 125,000 solar jobs. Alaska had the fewest with 92.
Jobs in solar electricity generation in all 50 states are plotted on the map below. Hover over the state to see the specific number.
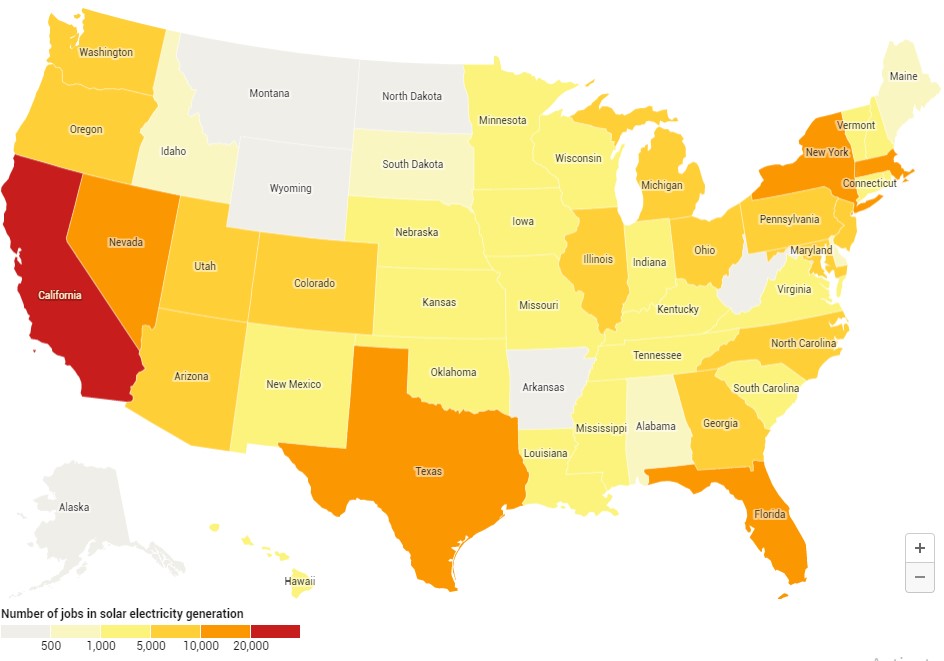
Solar jobs in each state. Map: Karin Kirk for Yale Climate Connections Source: 2020 U.S. State Energy Employment Reports
Generating electricity from wind employed about 115,000 people in the U.S. in late 2019. Wind jobs ranged from more than 25,000 in Texas to 47 in Delaware.
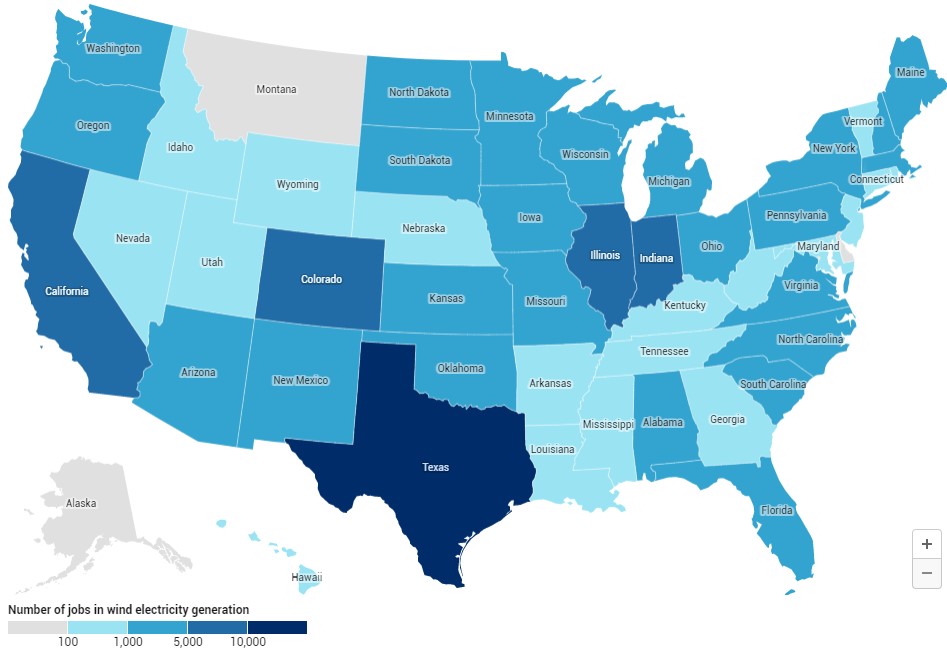
Wind jobs in each state. Map: Karin Kirk for Yale Climate Connections Source: 2020 U.S. State Energy Employment Reports
Renewable energy potential by state
The amount of wind and sun in any given location obviously affects job potential. The “usable” energy from wind and sunshine can be calculated in a few different ways.
On the most basic level, the resource potential is the amount of wind or sun that’s physically present in a given area. But a wind farm can’t be built on mountainous terrain or in a national park or protected area. So the technical potential accounts for topography and land use, as well as the technological capability of turbines and solar panels to capture energy.
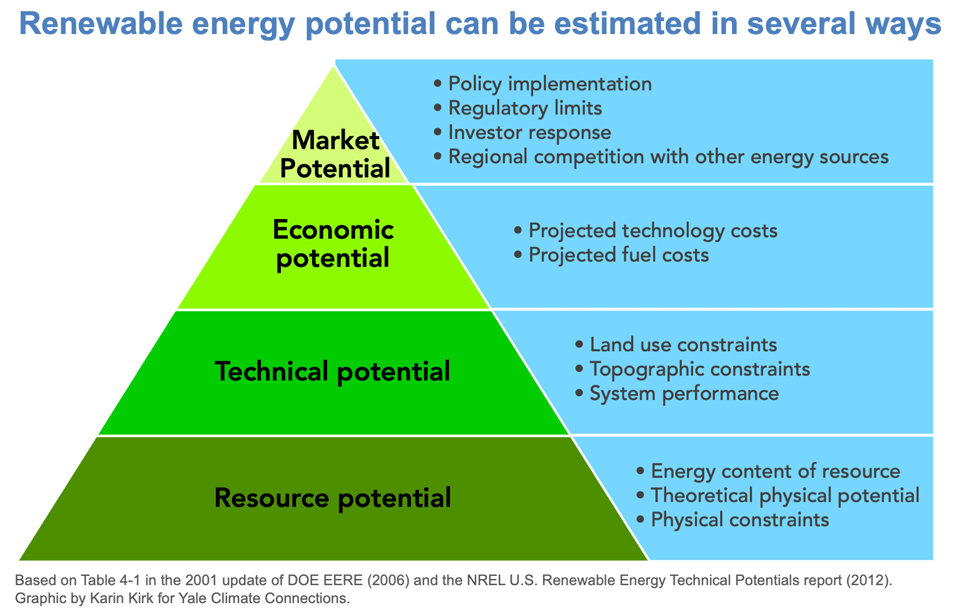
Beyond that, the realities of electricity transmission, markets, costs, and regulations will all affect how much renewable energy will be developed in a given location. These factors are part of the economic and market potential for each energy source. Although the market potential may be the most refined way to consider the possibilities for renewable energy, it also contains the largest uncertainty. For example, fiscal policy influences energy development via tax credits, pricing structures, subsidies, and so on. But how will these policies change in the coming years? It’s hard to say, especially on a state-by-state level.
As a result, the technical potential offers a reasonable baseline for quantifying the wind and sun, and it can easily be used to compare states to each other. The National Renewable Energy Laboratory analyzed the technical potential of 10 types of renewable energy technologies in its U.S. Renewable Energy Technical Potentials report, yielding estimates of the maximum amount of energy that is technically possible to derive from each of the 50 states. Nick Grue, Geospatial Data Scientist at the National Renewable Energy Laboratory, assisted with the selection of the appropriate dataset to use for this analysis.
Which states have the best solar energy potential?
The map below shows the sum of three types of solar potential:
Urban utility-scale solar, such as a solar farm in an urban area;
Rural utility-scale solar, which is by far the largest component of solar potential in each state; and
Rooftop photovoltaics on commercial and residential buildings.
The results on the map below are plotted in terawatt-hours. A terawatt-hour (TWh) is one million megawatt-hours.
Wind technical potential in each state. Map: Karin Kirk for Yale Climate Connections Source: 2020 U.S. State Energy Employment Reports
As one would expect, the greatest solar potential is in the southwestern U.S., and all things being equal, larger states have larger potential simply because there’s more room to capture the sunshine.
Protected land is excluded from technical potential, so a state like Utah, with its relatively large protected areas, has smaller potential than its neighbouring states. The Great Plains states, with wide-open spaces and plentiful sunshine, have strong potential for developing solar energy.
Recent research by NREL illustrates even more solar potential may become available in the plains states as “agricultural lands may offer the ability for active croplands to simultaneously host solar systems,” says Grue.
How well are states creating jobs in solar energy?
Dividing the job numbers by the technical potential yields an interesting measure: How well is each state making use of its sunshine?
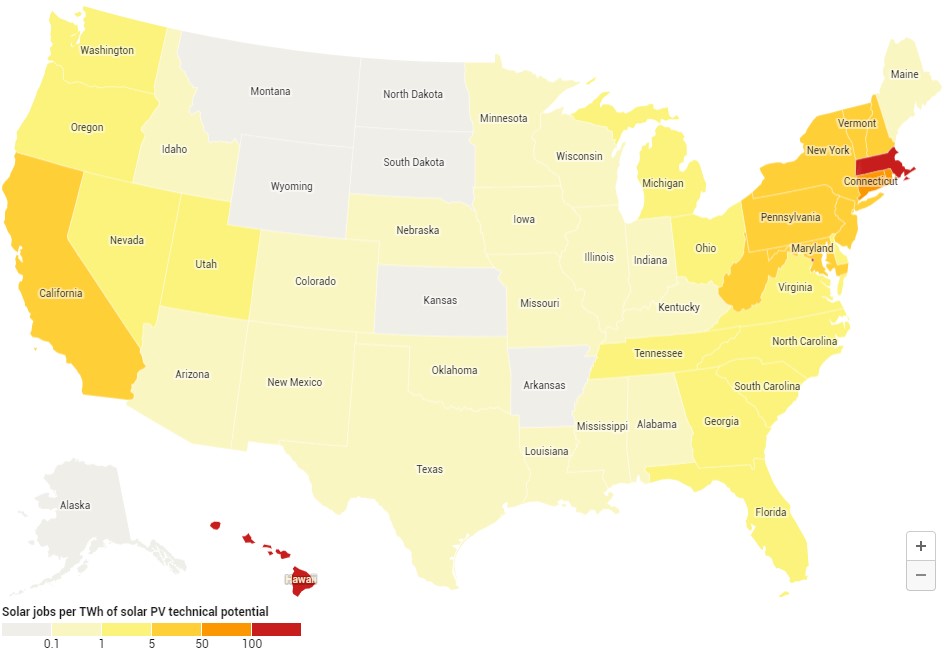
Solar jobs per TWh of solar potential. Map: Karin Kirk for Yale Climate Connections Source: 2020 U.S. State Energy Employment Reports
This map shows a picture vastly different from the previous one. For example, even though Texas has numerous jobs in solar energy, it also has enormous solar potential, so Texas’s ratio of jobs to potential turns out to be only average.
On the other hand, the mid-Atlantic region stands out because it has mediocre potential but plenty of jobs. Massachusetts is second only to California for solar jobs, but has a much smaller and more northerly geography. Despite those limitations, the Bay State has nearly 17,000 jobs in solar energy, giving it the best ratio of jobs per resource. Hawaii, with excellent sunshine but a tiny land area, has translated its solar potential into 4,000 jobs, earning a jobs-to-sunshine ratio well above other states.
The underperformance of the Northern Rockies and the Dakotas shows up in this analysis. These states have excellent solar potential, but solar job development in the region lags behind that of the rest of the country.
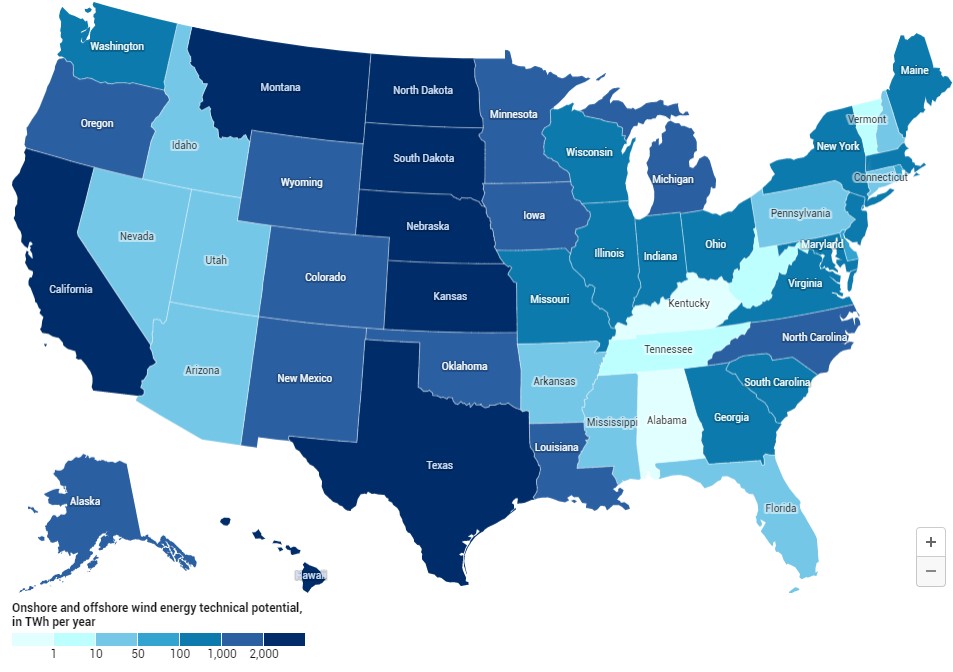
Which states have the best wind energy potential?
Addressing wind potential, the map below includes both land-based and offshore wind potential. Note that NREL has some brand new data for wind technical potential, but the information is not broken down by state, so it isn’t a good fit for this analysis.
Wind technical potential in each state. Map: Karin Kirk for Yale Climate Connections Source: 2020 U.S. State Energy Employment Reports
The Great Plains region offers the best overlap of high winds and usable land area. Even though the Rocky Mountain states are windier than the plains, the mountain states have more land that is excluded for topographic and environmental reasons. The states with the largest potential of usable wind are Texas, Kansas, Nebraska, and South Dakota.
How well are states creating jobs in wind energy?
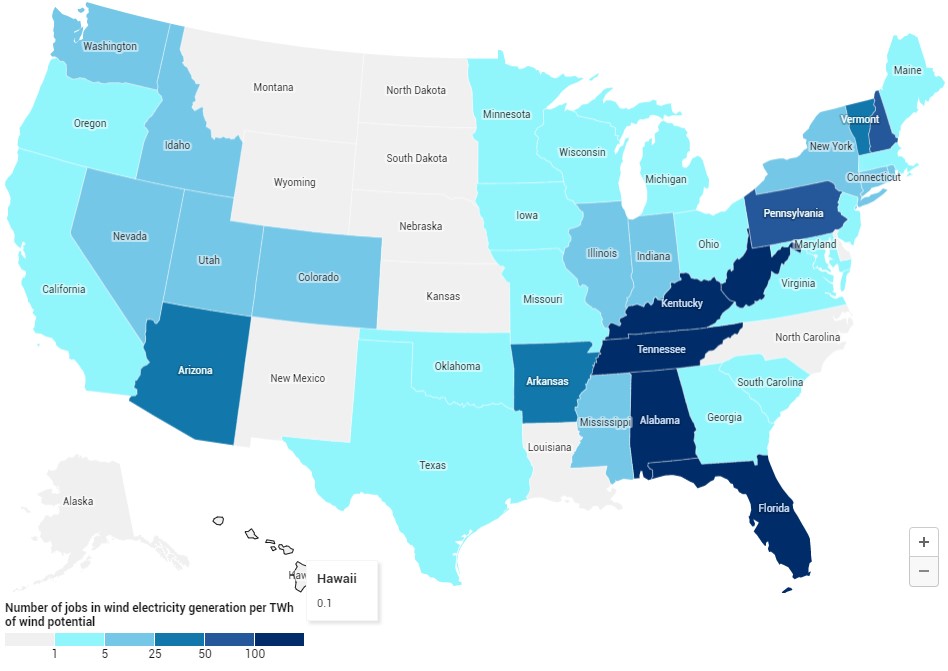
Wind jobs per TWh of wind potential. Map: Karin Kirk for Yale Climate Connections Source: 2020 U.S. State Energy Employment Reports
Despite the abundant wind potential in the Great Plains, these states have a relatively small number of wind jobs. For example, Montana has the seventh-best wind resource, but has only 86 jobs in wind energy generation, giving it the worst ratio of job creation among the states for the size of their wind resource. Alaska and Wyoming are in similar positions, and it’s probably not coincidental that these are all fossil fuel-producing states that emphasize jobs in oil, gas, and coal rather than harnessing their wind and sun. This analysis shows the untapped potential for job creation in these locations, especially important as these states are likely to lose fossil fuel jobs in the coming years. The good news for them is that new energy jobs can be created in those same regions.
On the other end of the spectrum, the map shows several southeastern states with excellent ratios of wind jobs to wind potential. Overall, this region has relatively low wind potential, so having even an average number of jobs but low potential yields a better-than-average ratio.
But a confusing caveat is that many of these states – such as Alabama, Arkansas, Tennessee, Kentucky, and Florida – have little or no installed wind capacity as of late 2020. How could they have wind jobs with no wind farms? One answer is that the job tally can include manufacturing, processing, or designing components used for wind energy elsewhere. For example, GE’s national distribution hub for wind turbine parts (as well as solar energy components) is located in Mississippi: So Mississippi has wind jobs but no wind generation in the state. Similarly, wind energy companies can be located within one state while working on projects located in other states. Another possibility is that a state may have jobs designing or building a wind farm that is not yet operational. As a result, the metric of local potential to local jobs is an imperfect measure in this respect.
Comparing installed capacity
One workaround for the problem of in-state jobs for out-of-state energy generation is to consider how much wind energy each state is generating compared to its overall potential. The map below doesn’t consider jobs and simply displays the amount of wind turbines installed compared to the technical potential.
This map shows that the southeastern U.S. has yet to tap into its potential for wind energy. Grue explains that as turbine technology evolves and turbines get taller, “higher wind speeds at greater heights will unlock previously uneconomic locations for new wind development” in places like the southeast.
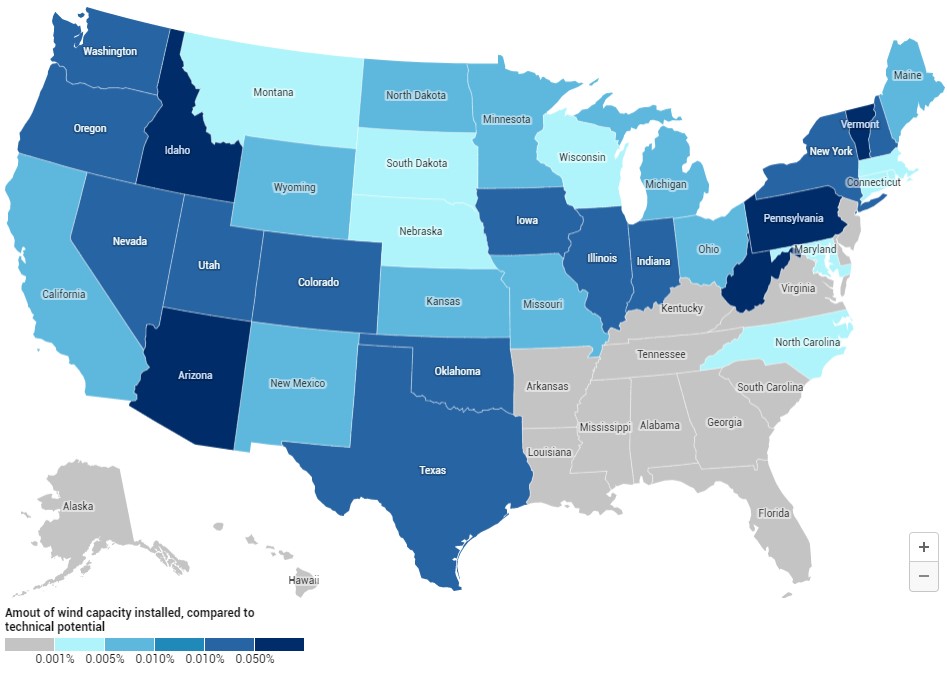
Installed wind capacity compared to maximum potential. Map: Karin Kirk for Yale Climate Connections Source: 2020 U.S. State Energy Employment Reports
A just and equitable transition
Assessing jobs on a statewide level is a useful tool, but it doesn’t speak to specific trades, communities, or individuals that face unemployment as a result of a changing industry. It’s not necessarily realistic for people to pick up and relocate across the state, or to another state, or reinvent their careers as energy markets shift.
That reality underscores the importance of emphasizing a transition to clean energy that embodies equity and inclusivity in planning, training, and hiring. Groups like Climate Justice Alliance are working at the intersection of social justice and climate action, noting that “if the process of transition is not just, the outcome will never be.”
At the same time, it’s worth noting that the oil and gas industry is well known for boom-and-bust employment cycles, and coal company bankruptcies are notorious for abandoning workers’ health care and benefits while often doling out lucrative bonuses to executives. There is enormous room for improvement in building an inclusive and equitable energy economy.
A certainty: Change is in the air
In places like Wyoming, convincing lawmakers that climate change is an urgent threat may be a bridge too far. But as coal jobs dwindle, new financial opportunities are literally blowing overhead, prompting climate-skeptic lawmakers to embrace wind energy.
As politicians fixate on jobs, climate advocates can do the same. Developing safe, local, renewable energy jobs offers a popular way forward for Americans and policymakers of all stripes.
—
This material [article] was written by Karin Kirk. It was published by Yale Climate Connections.


Comments