


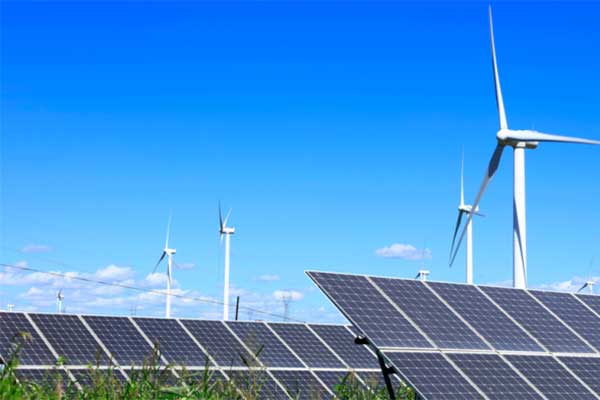
Washington DC — Domestic production and consumption of renewable energy (i.e., biofuels, biomass, geothermal, hydropower, solar, wind) reached an all-time high in 2021, according to a SUN DAY Campaign analysis of new data released by the U.S. Energy Information Administration (EIA).
The latest issue of EIA’s “Monthly Energy Review” report (with data through December 31, 2021) reveals that renewable sources accounted for more than one-eighth (12.61%) of the U.S. energy produced and 12.49% of the energy consumed for electricity, transportation, heating, and other uses. Renewable energy production during 2021 was 12.317 quadrillion Btu (quads) – 5.39% more than in 2020 and 5.89% more than in 2019.
A sharp drop in hydropower (down 8.79%) was more than offset by growth in all non-hydro renewables: solar energy (up 23.84%), wind (up 12.38%), biofuels (up 7.52%), geothermal (up 1.48%), and biomass (up 1.00%).
Wind is now the largest single renewable energy source, accounting for 27.05% of total U.S. renewable energy output, followed by biomass (21.41%), biofuels (19.15%), hydropower (18.54%), solar (12.19%), and geothermal (1.67%).
By comparison, production by the nation’s nuclear power plants in 2021 dropped by 1.48% and 3.82% compared to 2020 and 2019 levels. As a consequence, energy provided by renewable sources in 2021 exceeded nuclear generation by more than 50% (12.317 quads vs. 8.129 quads).
Last year, renewable energy production also surpassed that of coal by 6.54% (12.317 quads vs. 11.561 quads). While energy produced from coal increased over its 2019 level (10.703 quads), it was still less than any prior year going back to the early 1960s.
However, domestic energy production from all fossil fuel sources combined (i.e., oil and natural gas as well as coal) increased by 2.03% and accounted for 79.08% of the total. That, in turn, contributed to a 6.12% increase in carbon dioxide (C02) emissions attributable to U.S. energy consumption.
“The continued expansion of renewable energy’s share of U.S. energy production and consumption is encouraging,” noted the SUN DAY Campaign’s executive director Ken Bossong. “However, EIA’s latest data provide a clear warning that the pace of that growth must accelerate rapidly if we are to avoid the worst consequences of climate change.”
—
SUN DAY Campaign


Comments